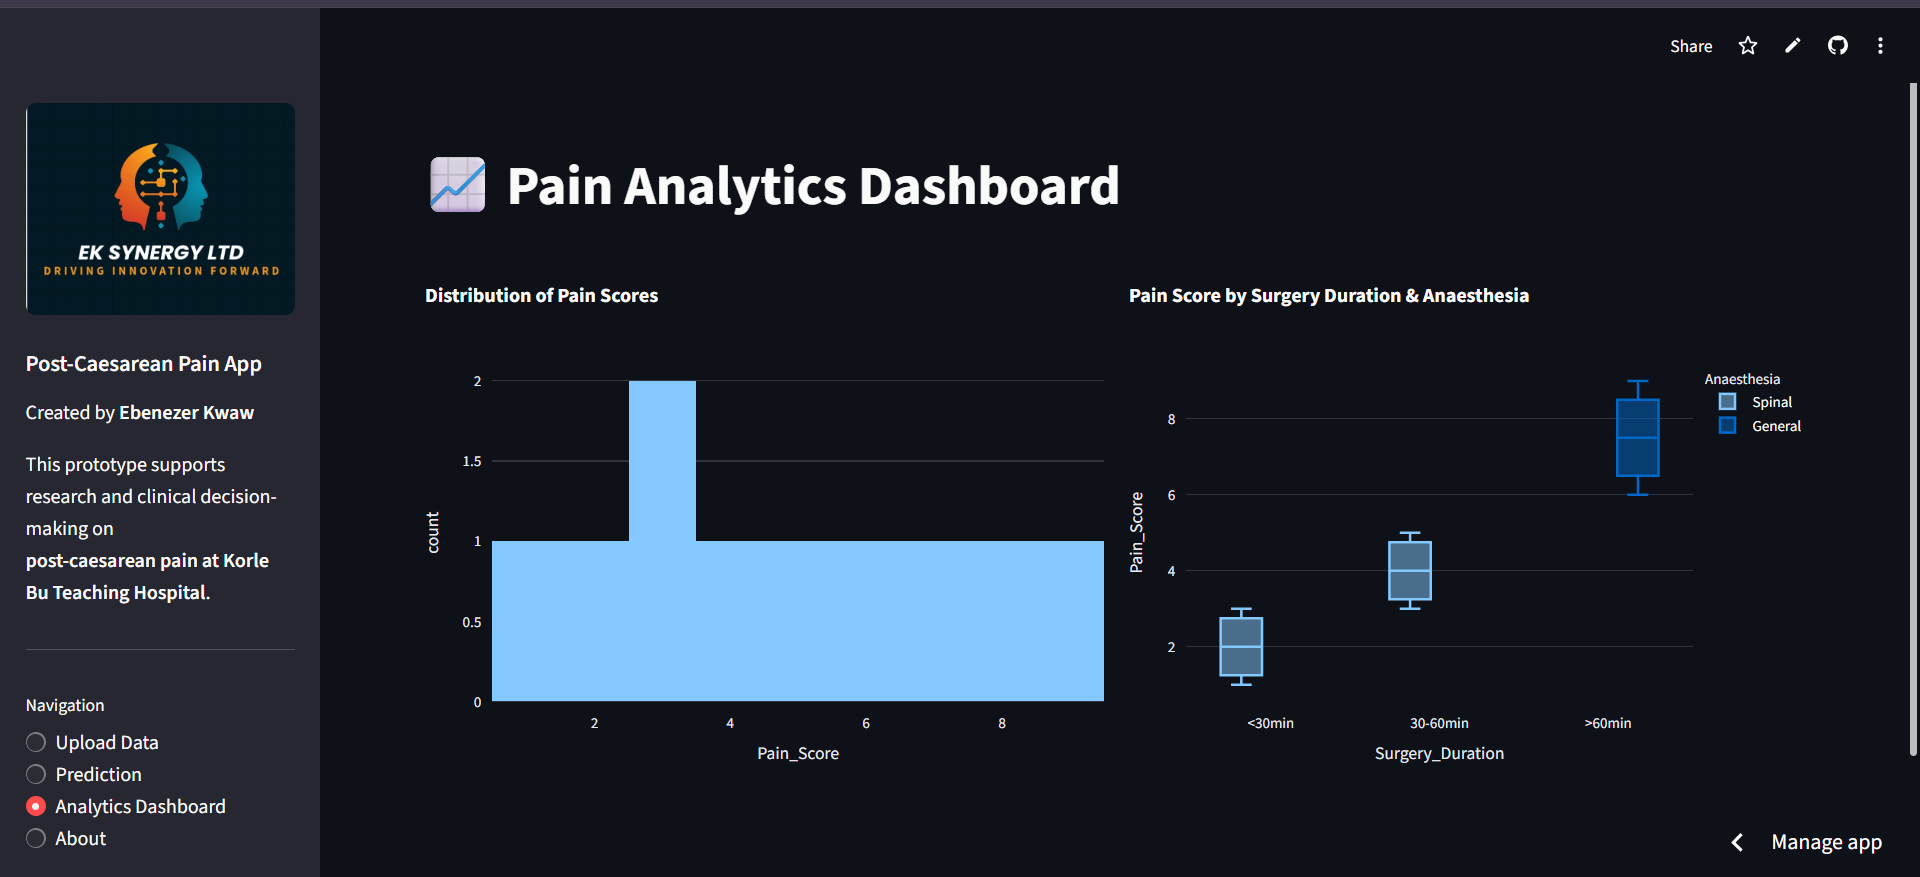
A research-support application for collecting, analyzing and exploring the risk of moderate-to-severe pain after caesarean section.
The challenge
Manual analysis can slow research and make it harder to combine data entry, visualization and exploratory prediction in one accessible workflow.
The strategy
Create a simple research dashboard that accepts common data formats, summarizes patterns and demonstrates an interpretable prediction workflow.
My contribution and execution
- Designed upload support for CSV, Excel and form-derived datasets.
- Created tables and charts for pain patterns and patient characteristics.
- Added an exploratory risk-prediction component.
- Deployed a Streamlit-based interface intended for research demonstration.
Tools and methods
Python, data analysis, visualization, Streamlit, GitHub and cloud deployment
Outcome, evidence and limitations
The application is a research prototype and does not provide a clinical diagnosis or treatment recommendation. Clinical use would require a defined dataset, protocol, external validation, safety review and institutional approval.
Why this project matters
This project demonstrates how I translate a practical problem into a structured strategy, prototype or analytical workflow. It also records the limits of the current work and the next validation needed before broader use.
← Back to all insights