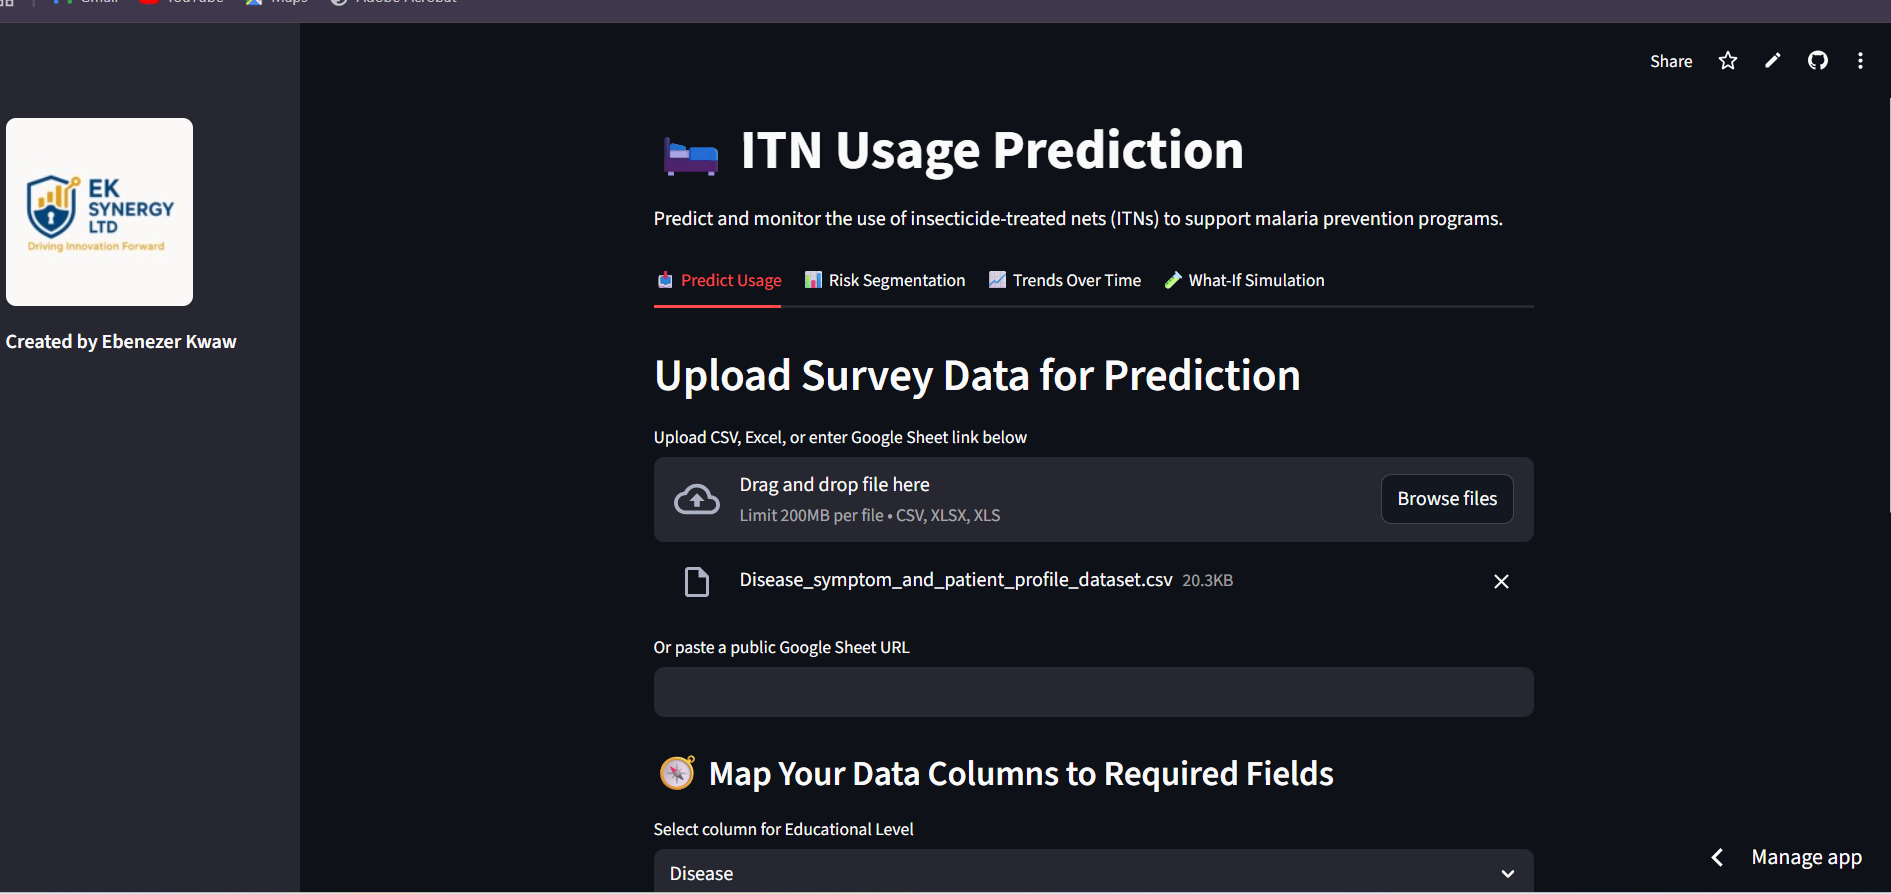
A malaria-prevention dashboard exploring predicted insecticide-treated net use, risk segmentation, trends and intervention scenarios.
The challenge
ITN distribution does not guarantee use, while retrospective reporting offers limited support for targeting behavioral and access interventions.
The strategy
Combine survey-data processing, classification, risk segmentation and what-if scenarios in one decision-support dashboard.
My contribution and execution
- Designed automated data ingestion and dynamic column mapping.
- Explored demographic, education and access features linked with reported ITN use.
- Compared classification approaches including logistic regression and random forest.
- Added risk segments, trend views and intervention-simulation concepts.
Tools and methods
Python, Pandas, scikit-learn, classification modeling and Streamlit
Outcome, evidence and limitations
The application demonstrates how survey data could support programme planning. Predictions require external validation, representative data, bias review and public-health interpretation before operational use.
Why this project matters
This project demonstrates how I translate a practical problem into a structured strategy, prototype or analytical workflow. It also records the limits of the current work and the next validation needed before broader use.
← Back to all insights