A UI/UX case study for automating questionnaire analysis and presenting nutrition-behavior and AI-adoption patterns.
The challenge
Manual questionnaire processing is time-consuming and may delay interpretation of demographic and nutrition-behavior patterns.
The strategy
Design an upload-to-insight workflow that makes distributions, cross-tabulations and correlations accessible to researchers and nutrition professionals.
My contribution and execution
- Mapped the workflow from upload through processing, analysis and visualization.
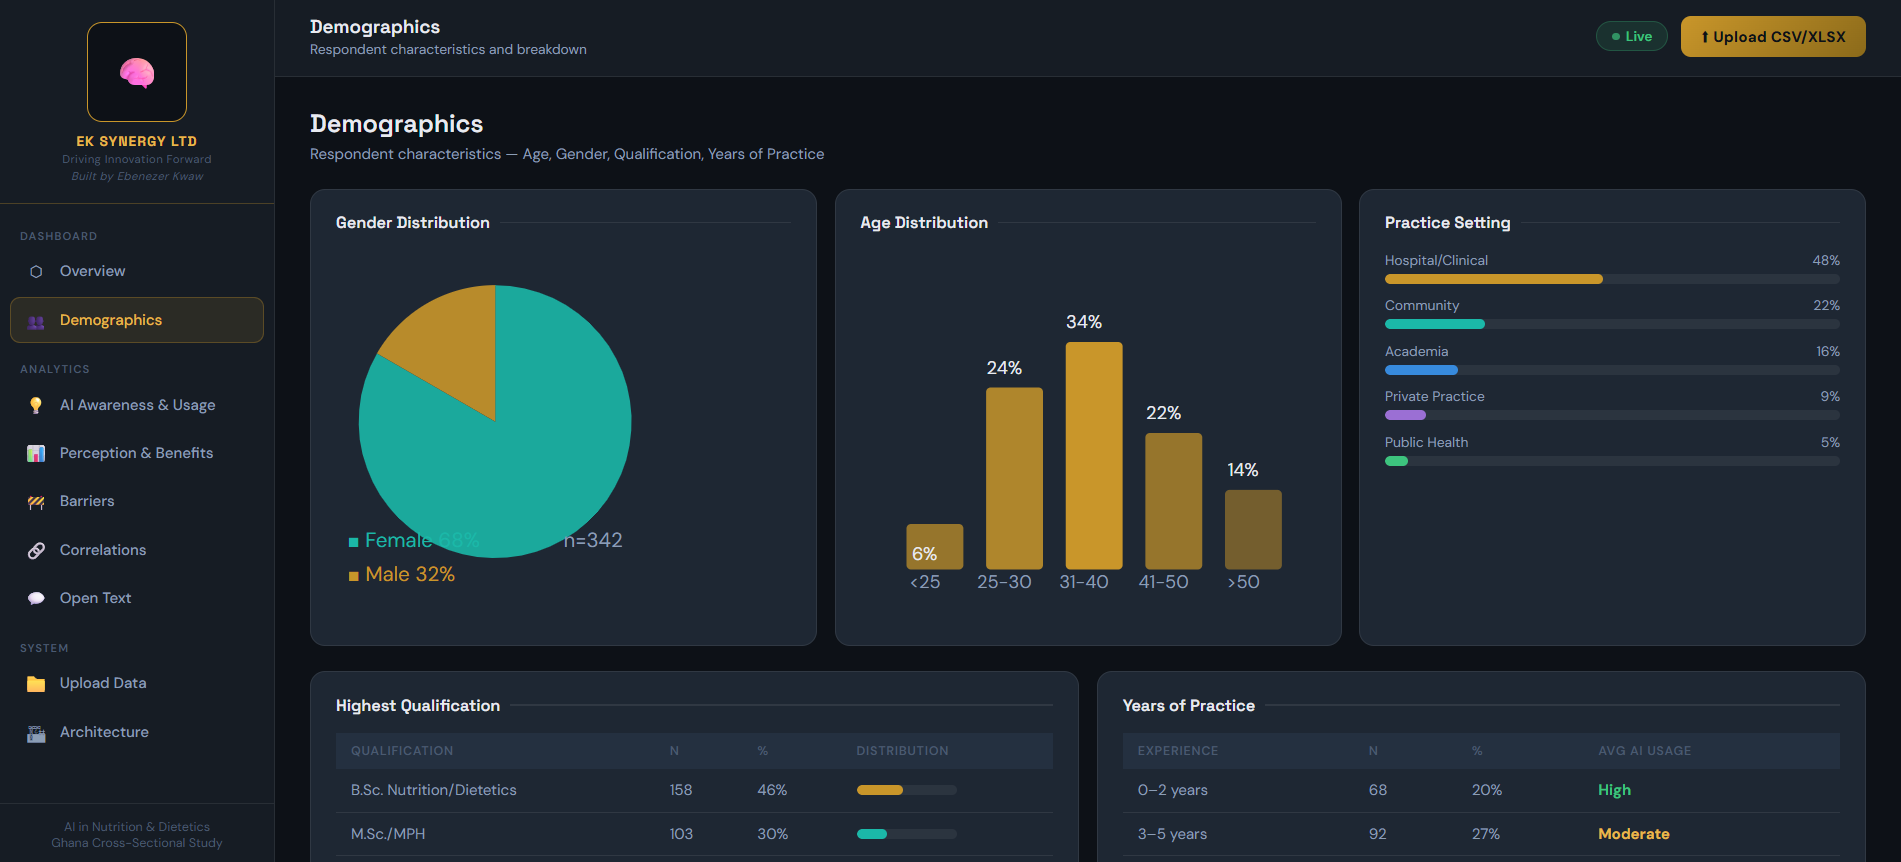
- Designed demographic, AI-usage and correlation views.
- Included exportable reports and cross-tabulation concepts.
- Proposed a full-stack architecture and future extensions for prediction, scheduled imports, multilingual support and field collection.
Tools and methods
UI/UX design, React concept, Node.js concept, Python analytics, PostgreSQL concept, D3.js and Chart.js
Outcome, evidence and limitations
The case study uses AI-generated example data that must be replaced or verified before analysis. It is a UI/UX and product concept, not evidence of a validated nutrition surveillance platform.
Why this project matters
This project demonstrates how I translate a practical problem into a structured strategy, prototype or analytical workflow. It also records the limits of the current work and the next validation needed before broader use.
← Back to all insights